📝 Summary
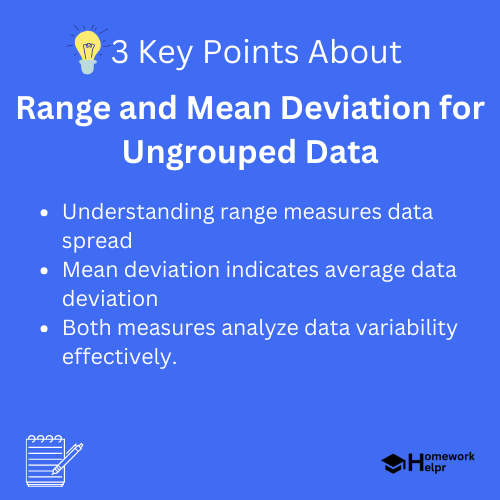
In statistics, the concepts of range and mean deviation are essential for analyzing ungrouped data. The range indicates the spread of data points by measuring the difference between the maximum and minimum values. In contrast, mean deviation reflects how far data points deviate from the average, considering all values for a comprehensive understanding of variability. Both measures are vital in various fields such as education, finance, and research for effective data analysis and informed decision-making.
Understanding Range and Mean Deviation for Ungrouped Data
In the world of statistics, two important concepts that play a significant role in understanding the variation within a dataset are range and mean deviation. These concepts are crucial for analyzing ungrouped data, which refers to individual data points that are not grouped into categories. In this article, we will explore these concepts in detail, providing definitions, formulas, and examples for better understanding.
What is Range?
The range is a simple and effective measure of variability, showing the spread of a set of data points. It is the difference between the highest and lowest values in the dataset. The formula to calculate range is:
For instance, if we have a dataset containing the ages of students: 15, 18, 20, 22, and 24. The maximum age is 24 and the minimum age is 15. Therefore, the range can be calculated as:
Examples
A data set of test scores: 65, 75, 80, 90, 100. The range is calculated as 100 – 65 = 35.

Understanding the range helps in quickly assessing how spread out the values in a dataset are, giving insight into its variability. However, it is crucial to remember that range only considers the extremes and may not provide a complete picture of the data’s distribution.
Definition
Variability: A statistical measure that demonstrates how much the data points differ from each other.
What is Mean Deviation?
The mean deviation, also known as the average deviation, is another important measure of dispersion. It indicates how much the data points deviate from the mean (average) of the dataset. The formula for calculating the mean deviation is:
Where:
- |x_i – mu| represents the absolute difference of each data point from the mean.
- n is the total number of data points.
To better understand mean deviation, let‚’ consider the following dataset: 4, 8, 6, and 10. First, we calculate the mean:
Next, we find the absolute deviations of each value from the mean:
- |4 – 7| = 3
- |8 – 7| = 1
- |6 – 7| = 1
- |10 – 7| = 3
Now, we calculate the mean deviation:
Examples
For example, if the scores are 30, 32, 34, and 36, the mean is 33, and the mean deviations would be |30-33|, |32-33|, |34-33|, and |36-33|.
Comparing Range and Mean Deviation
While both range and mean deviation help in understanding variability, they serve different purposes. The range provides a quick overview of the data spread, but it ignores the distribution of values. Mean deviation, on the other hand, takes all data points into account, offering a more comprehensive understanding of how data points differ from the mean.
A key difference is that the range can be influenced by outliers (extreme values), whereas the mean deviation gives a better picture of the dataset’s consistency. Hence, it’s important to use both measures in conjunction to gain insights into the dataset’s characteristics.
❓Did You Know?
The concept of mean deviation dates back to the early 1800s when it was first introduced by mathematician Karl Friedrich Gauss.
Applications of Range and Mean Deviation
Understanding range and mean deviation has practical implications in various fields, including:
- Education: Teachers analyze student scores using these metrics to assess overall performance.
- Finance: Investors evaluate stock prices’ volatility with these measures to gauge potential risks.
- Research: Scientists use statistical measures to interpret data findings and draw meaningful conclusions.
Each application emphasizes the importance of understanding data variability, enhancing decision-making processes based on analyzed data.
Conclusion
Unraveling the concepts of range and mean deviation is vital for anyone delving into the field of statistics. They allow us to quantify the variability in ungrouped data effectively. While the range offers a snapshot of data spread, the mean deviation provides a more nuanced understanding of data consistency. Together, these measures serve as powerful tools for analysis in numerous fields, from education to finance.
As students of statistics, mastering these concepts will equip you with the skills necessary for analyzing data accurately and making informed decisions based on your findings. Keep practicing with different datasets, and soon, you will be a proficient stats expert!
Related Questions on Range and Mean Deviation for Ungrouped Data
What is range?
Answer: Range is the difference between highest and lowest values.
How is mean deviation calculated?
Answer: It is calculated by averaging absolute deviations from the mean.
Why are range and mean deviation important?
Answer: They help understand variability in datasets.
Where are these concepts applied?
Answer: In fields like education, finance, and research.
