📝 Summary
Frequency distribution is a method in statistics used to represent how often different values appear in a dataset, enhancing our ability to organize and interpret large data sets. It consists of key components such as class intervals, frequencies, and cumulative frequencies, which help visualize patterns in the data. This technique is essential for data analysis, enabling users to make informed decisions based on identified trends and anomalies. Understanding frequency distributions is vital for students, researchers, and analysts alike.
Understanding Frequency Distribution
Frequency distribution is a concept used to represent how often different values occur in a dataset. It helps in organizing raw data into a structured format. In statistics, this method allows us to visualize and comprehend large sets of data more effectively. By grouping the data into classes or intervals, we can easily identify patterns and make informed decisions based on the results.
A frequency distribution typically consists of three main components: categories (or class intervals), frequencies, and sometimes cumulative frequencies. Each component serves a unique purpose in analyzing the data, allowing us to interpret the information clearly.
Definition
Frequency: The number of times a particular value or category occurs in a dataset.
Cumulative Frequency: The total number of observations in a dataset that are less than or equal to a certain value.
Components of Frequency Distribution
Understanding the components of a frequency distribution is essential for interpreting data correctly. Here are the key components:
- Class Intervals: These are the groups into which the data is divided. For example, if we are analyzing students’ scores, class intervals might be 0-10, 11-20, etc.
- Frequencies: This indicates the number of observations that fall within each class interval. For instance, if five students scored between 0-10, the frequency for that class interval would be 5.
- Cumulative Frequencies: This counts the total number of observations that lie within the class interval or below it. It helps to understand the distribution pattern of the data.
The Importance of Frequency Distribution
The significance of frequency distribution cannot be overlooked, especially in data analysis. Here are some reasons why it is essential:
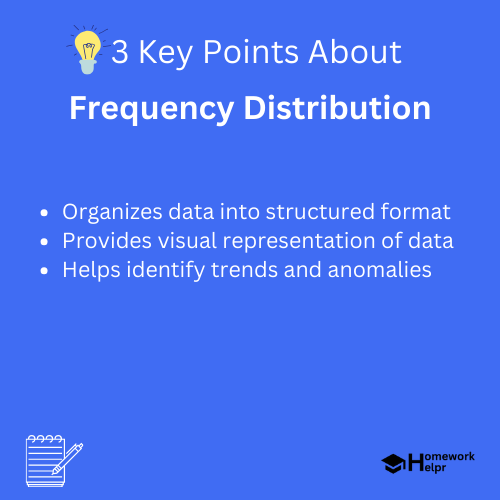
- Data Organization: Frequency distributions help in organizing data systematically, making it easier to analyze.
- Visual Representation: They provide a way to visually present data through histograms and bar charts, offering a clearer understanding of patterns.
- Identifying Trends: Helps in spotting trends and anomalies in data analysis, allowing for better decision-making.
Using frequency distribution not only simplifies the complexity of data but also provides a snapshot of the overall data behavior. When data is categorized and displayed, it helps in identifying which groups have higher or lower occurrences, thereby facilitating better analysis.
❓Did You Know?
Did you know that one of the earliest recorded uses of frequency distribution dates back to 17th-century England, where it was used in analyzing population data?
Creating a Frequency Distribution Table
Creating a frequency distribution table is quite simple and involves a few steps. Follow this method to construct your own table:
- Step 1: Collect your raw data and determine the range (the difference between the maximum and minimum values).
- Step 2: Decide on the number of classes you want your data sorted into. Generally, between 5 to 20 classes is a good range, depending on the data size.
- Step 3: Calculate the class width using the formula:
- Step 4: List the class intervals in the first column, and count the frequency of observations in each interval to fill the second column.
- Step 5: If necessary, calculate cumulative frequencies and record them in the third column.
Examples
For example, if you have the following data of students’ scores: 12, 15, 12, 10, 11, 16, 19, 17, you can create class intervals of 10-12, 13-15, and count the corresponding frequencies as shown:

Types of Frequency Distribution
There are various types of frequency distributions, each tailored for specific data types. Here’s a quick overview:
- Simple Frequency Distribution: Displays the frequency count for each unique value in a dataset. It‚’ straightforward and easy to understand.
- Cumulative Frequency Distribution: Shows the accumulation of frequencies over class intervals, helping to identify the percentile rank of particular data points.
- Relative Frequency Distribution: Represents the frequency of each class as a fraction or percentage of the total number of observations. This aids in understanding the proportion of data points that fall into each class.
Choosing the right type of frequency distribution depends on what you aim to analyze. For instance, simple frequency distribution is best for small datasets, while cumulative and relative distributions provide more insights for larger datasets.
Applications of Frequency Distribution
Frequency distributions are utilized across various fields such as:
- Education: Teachers can analyze student performance and determine grade distributions.
- Healthcare: Medical researchers can track the occurrence of diseases in specific populations.
- Business: Companies can assess customer preferences based on product sales data and market surveys.
The utility of frequency distributions extends beyond just statistics; it finds practical applications that help individuals and organizations make data-driven decisions.
Conclusion
In summary, understanding frequency distribution is fundamental for anyone dealing with data. It acts as a critical tool for data analysis, allowing for easy manipulation and interpretation of datasets. By organizing data into frequency tables and visualizing them through graphical representations, we can analyze trends and make informed decisions. Whether you are a student, a researcher, or a business analyst, mastering frequency distribution will enhance your analytical capabilities and provide valuable insights into the information at hand.
Related Questions on Frequency Distribution
What is frequency distribution?
Answer: It represents the occurrence of values in a dataset.
What are the key components of frequency distribution?
Answer: Categories, frequencies, and cumulative frequencies.
Why is frequency distribution important?
Answer: It simplifies data analysis and reveals patterns.
What are some applications of frequency distribution?
Answer: Used in education, healthcare, and business analysis.
