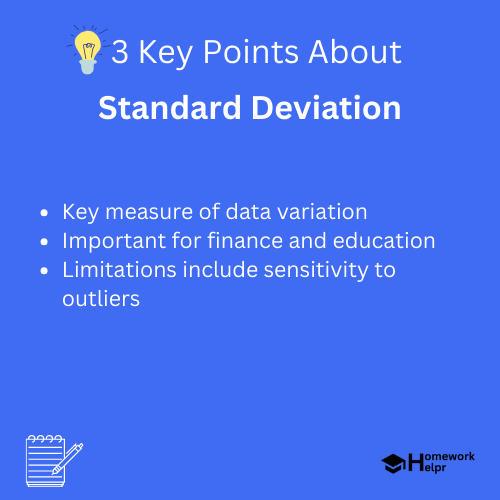
📝 Summary
In statistics, standard deviation is a key measure of variation or dispersion within data. It reveals how much individual data points differ from the average. Understanding standard deviation involves grasping related terms like variance, which calculates the squared differences from the mean, and normal distribution, depicting data spread. Its importance lies in assessing risk in finance, evaluating sample representativeness, and analyzing student performance. While a powerful tool, it has limitations, particularly regarding outliers and non-normal distributions.
Understanding Standard Deviation
In the world of statistics, standard deviation is a crucial measure used to quantify the amount of variation or dispersion in a set of data values. It helps us understand how much individual data points differ from the average or mean of the dataset. When dealing with numbers, everyone wants to know not just the average, but also how spread out the numbers are, and this is where standard deviation comes into play.
To fully grasp the concept of standard deviation, it‚’ essential to first understand the key terms associated with it. Variance, a related measure, indicates how far each number in the set is from the mean and is calculated as the average of the squared differences. The normal distribution is another vital concept, representing how data points are distributed in a bell-shaped curve. Finally, population refers to the entire set of data you‚Äôre analyzing, while a sample is a portion of that population.
Definition
Standard Deviation: A statistical measure that indicates the extent to which data points deviate from the mean.
Variance: The average of the squared differences from the mean in a dataset.
Normal Distribution: A probability distribution that is symmetric about the mean, depicting how values are distributed.
Why is Standard Deviation Important?
Standard deviation is important for various reasons:
- It provides insights into the risk and unpredictability of data, particularly in finance.
- Researchers use it to determine how representative a sample is relative to an entire population.
- In the field of education, it assesses student performance metrics, showcasing the spread of scores.
For instance, if a teacher averages a score of 85 in a class but discovers a very high standard deviation, it implies that some students scored much lower or much higher than 85, indicating varying levels of comprehension among students.
Examples
If the scores in a test are 70, 80, 90, and 100, the mean is 85, but if the standard deviation is high, say 15, it indicates that the scores are not closely clustered around the average.
How to Calculate Standard Deviation
The calculation of standard deviation can seem complex, but breaking it down can make it much simpler. Here‚’ a step-by-step guide:
- First, calculate the mean (average) of your dataset.
- Next, subtract the mean from each data point and square the result. This gives you the squared differences.
- Then, find the average of those squared differences. This value is known as the variance.
- Finally, take the square root of the variance. This final value is your standard deviation.
To illustrate, let‚’ say we have the numbers: 2, 4, 4, 4, 5, 5, 7, 9. The mean of these numbers is:
Now, calculating the variance involves:
Finally, the standard deviation is the square root of the variance:
Examples
If we had scores of 56, 58, 60, and 64, they would average to 59. The squared deviations from the mean would be calculated, leading to a variance that captures how spread out the scores are around that average.
Understanding Different Contexts of Standard Deviation
Standard deviation is used across different disciplines and contexts. Let‚’ examine a few:
- Finance: Investors use standard deviation to measure the price fluctuations of stocks.
- Quality Control: Manufacturers monitor production quality by checking the consistency of product dimensions.
- Education: Schools analyze student test scores to determine overall academic performance and identify areas needing improvement.
In finance, if an investment‚’ standard deviation is low, it is considered stable. Conversely, a high standard deviation indicates high volatility, which can signify greater risk but also higher potential returns.
❓Did You Know?
A statistical discovery found that around 68% of data points fall within one standard deviation of the mean in a normal distribution!
Limitations of Standard Deviation
While standard deviation is a powerful tool, it also comes with certain limitations. For instance:
- It is sensitive to outliers, which can significantly affect the value.
- In cases of non-normal distributions, standard deviation doesn’t provide a clear picture of spread.
- It cannot indicate the direction of variation, only the degree.
For instance, if most of your data points are clustered together but a few extreme scores exist, the standard deviation might suggest a level of spread that doesn’t accurately represent the dataset. Thus, in such cases, it may be advisable to supplement standard deviation with other statistical measures like the interquartile range (IQR).
Conclusion
Standard deviation is a vital statistic that helps us understand the spread and variability within a set of data. By calculating it, you gain insights into how much individual entries differ from the mean. Whether in finance, education, or any field that involves data, understanding how to compute and interpret standard deviation can enhance your ability to analyze information effectively.
Remember, while it is a powerful measure, it’s essential to consider its limitations and complement it with other statistics when necessary. With practice and application, you can master the concept of standard deviation, enabling you to analyze data sets with confidence.

Related Questions on Standard Deviation
What is standard deviation?
Answer: A measure of data point dispersion around the mean.
Why is standard deviation important?
Answer: It assesses risk, representativeness, and performance spread.
How is standard deviation calculated?
Answer: By finding the mean, squared differences, and square root of variance.
What are the limitations of standard deviation?
Answer: Sensitive to outliers and does not indicate variation direction.
